Report Highlights. Student loan forgiveness statistics indicate that, while more students benefited from forgiveness in 2023 than ever, the total dollar amount forgiven was 1% of the national outstanding student loan debt balance.
- Among processed applications for Public Service Loan Forgiveness (PSLF), 2.3% have been accepted since November 2020.
- Among denied claims, 24.6% are denied due to incomplete paperwork.
- 14.4% of PSLF applications have yet to be processed.
- Prior to November 2020, 1% of eligible borrowers eventually benefited from student loan forgiveness.
- 18.4% of eligible student borrowers apply for loan forgiveness.
Related reports include Student Loan Debt Statistics | College Enrollment Statistics | How Do People Pay for College? | Average Time to Repay Student Loans | Average Cost of College | 144 Student Loan Forgiveness Programs | Student Loan Refinancing
Student Loan Forgiveness Overhaul
As of 2023, more borrowers benefit from student loan forgiveness than ever before thanks to expanded eligibility.
- A total of 441,234 students had their loans forgiven, either in part or in full, through federal forgiveness programs prior to 2021.
- In that time, $101 per indebted student borrower was the rate at which the federal government forgave student loans.
- In 2021, at least 30,000 additional borrowers had their debts reduced to $0 under the Public Service Loan Forgiveness (PSLF) temporary expansion waiver.
- The approximate average debt among these borrowers was $93,061.
- The U.S. Department of Education (ED) estimates that 550,000 borrowers could eventually benefit from temporarily expanded eligibility.
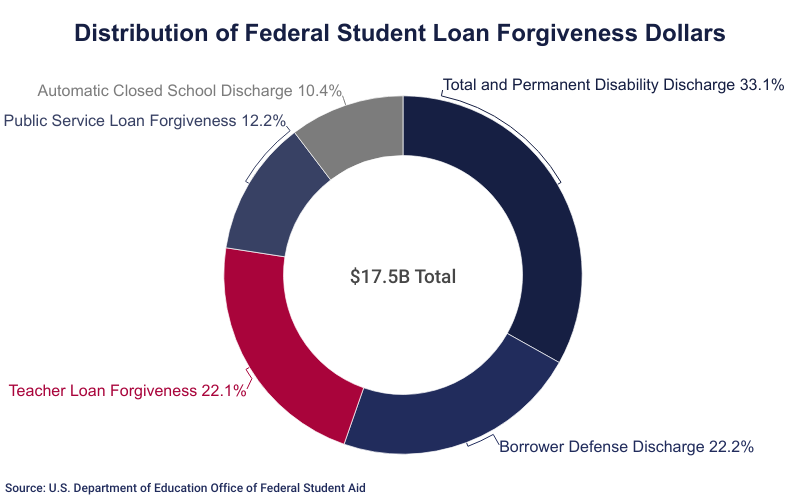
- Among all student loan borrowers, at least 323,000 have had loans forgiven due to total and permanent disability; each had an approximate average of $17,957 forgiven.
- At least 190,000 have each had an approximate average of $20,410 forgiven due to having attended defunct schools and/or institutions that defrauded its students.
- In total, these recently forgiven debts are equivalent to 1.01% of the total student loan debt balance.
- Federal loans account for $1.62 trillion or 92.48% of the total student loan debt.
- 23% of Americans believe all existing student loans should be forgiven by the U.S. government, regardless of circumstances.
- The greater their income, the less likely someone is to support student loan debt forgiveness.
Federal loan forgiveness, cancellation, or discharge may apply to PLUS loans, direct loans, stafford loans, consolidation loans, and Federal Family Education Loans (FFEL).
Pre-2021 Student Loan Forgiveness Statistics
Prior to 2021, just 2.5% of borrowers applied for loan forgiveness; less than 0.3% (#1) (#4) of student loan debt was eventually forgiven.
- Around 2.6% of applicants for federal student loan forgiveness had the remainder of their student loan payments discharged following several years of required payments.
- The Higher Education Act, which expanded loan forgiveness in 2008, was never funded by Congress.
- Among people who applied for loan forgiveness prior to 2021, most applications went to the Teacher Loan Forgiveness Program, the Borrower Defense to Repayment Discharge Program, and the Public Service Loan Forgiveness Program.
- These programs had a combined average of 144,459 applications pending at any given time.
- 3 million+ student loan borrowers were either eligible or approaching eligibility for student loan forgiveness.
- 25.9% of new graduates with law school debt said they chose a job that was likely to qualify them for loan forgiveness over a job they actually wanted.
Public Service Loan Forgiveness (PSLF)
Employment with a government entity or non-profit organization may make you eligible for student loan forgiveness. Denied applicants may still be eligible for Temporary Expanded Public Service Loan Forgiveness (TEPSLF).
- 93.3% of forms processed after November 9, 2020 (11/9/2020) meet employment certification requirements.
- Among this set of processed forms, 3.3% meet the requirements for PSLF.
- 39.3% of eligible applicants work for non-profit organizations.
- 32.3% of approved PSLF applications are for non-profit workers.
- 60.7% of applicants work for the U.S. government.
- 67.7% of approved PSLF applications are for U.S. government workers.
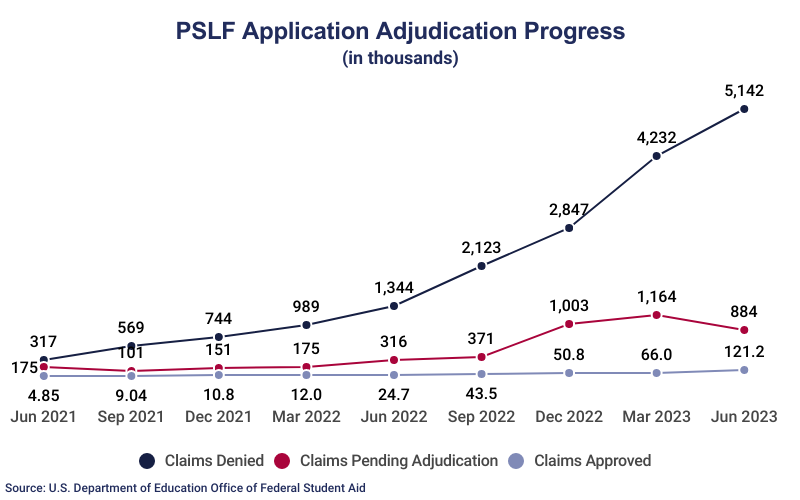
- In 2023, an average of 1.04 million PSLF applications were pending at any given time.
- 24.1% of processed forms are incomplete, due to missing information.
- 24.6% of denied claims are submitted with missing information.
- $182.0 billion is the total outstanding balance of borrowers eligible for PSLF.
- $1.85 billion has been forgiven through PSLF since the program’s inception.
- That’s an average of $301 per application submitted.
- $96,343 is the average discharge amount for an approved PSLF applicant.
- 62.6% of loans forgiven are on income-driven-repayment (IDR) plans.
| Claims Approved | Claims Denied* | Claims Pending | |
|---|---|---|---|
|
Jun 2023 |
121,221 |
5,142,429 |
884,162 |
|
May 2023 |
108,153 |
4,975,850 |
867,518 |
|
Apr 2023 |
75,546 |
4,449,439 |
973,513 |
|
Mar 2023 |
66,018 |
4,231,821 |
1,164,259 |
|
Feb 2023 |
51,037 |
3,711,950 |
1,128,643 |
|
Jan 2023 |
52,616 |
3,298,495 |
1,206,150 |
|
Dec 2022 |
50,790 |
2,846,502 |
1,003,433 |
|
Nov 2022 |
50,319 |
2,681,847 |
709,782 |
|
Oct 2022 |
46,781 |
2,388,697 |
462,319 |
|
Sep 2022 |
43,459 |
2,122,808 |
371,138 |
|
Aug 2022 |
40,463 |
2,007,456 |
391,565 |
|
Jul 2022 |
27,505 |
1,651,135 |
233,854 |
|
Jun 2022 |
24,743 |
1,343,609 |
315,881 |
|
May 2022 |
18,082 |
1,193,999 |
249,351 |
|
Apr 2022 |
13,275 |
1,075,326 |
210,685 |
|
Mar 2022 |
11,997 |
988,688 |
174,987 |
|
Feb 2022 |
11,100 |
900,850 |
172,842 |
|
Jan 2022 |
10,941 |
830,163 |
153,312 |
|
Dec 2021 |
10,759 |
744,149 |
151,145 |
|
Nov 2021 |
10,354 |
680,771 |
125,591 |
|
Oct 2021 |
9,990 |
625,058 |
105,049 |
|
Sep 2021 |
9,038 |
568,728 |
100,607 |
|
Aug 2021 |
7,666 |
416,110 |
192,157 |
|
Jul 2021 |
6,322 |
364,677 |
184,989 |
|
Jun 2021 |
4,848 |
316,931 |
175,013 |
|
May 2021 |
4,214 |
272,002 |
167,125 |
|
Apr 2021 |
3,458 |
241,910 |
145,965 |
| No reports published from December 2020 to March 2021 | |||
*This includes claims denied due to information missing from the applicant’s submitted forms.
PSLF Before 2021 Overhaul
Statistics indicate that little has changed for borrowers applying for PSLF, with more claims pending than ever before. Government employees are still more likely to be approved for PSLF than other non-profit employees. Applications are approved at roughly the same rate.
- 2.3% of processed applications for PSLF had been approved since the program’s inception.
- In the program’s first year, 0.32% of applications were approved.
- Prior to 2021, 3.3 million student loan borrowers were eligible to apply for PSLF (though only 6.9% applied).
- From March to November 2020, the rate of claim approvals increased 32.4%.
- From March 2019 to March 2020, total claim denials increased 128%.
- As of November 2020, 38% of eligible applicants worked for non-profit organizations.
- 27% of approved PSLF applications were for non-profit workers.
- Prior to 2021, 62% of applicants worked for the U.S. government.
- 73% of approved PSLF applications were for U.S. government workers.
- Prior to 2021, an average of 15,088 PSLF applications were pending at any given time.
- 59% of denied applications were rejected due to too few qualifying payments.
- 26% of denied applications were due to missing information.
- As of November 2020, $118.5 billion was the total outstanding balance of borrowers eligible for PSLF.
- Prior to 2021, $290.4 million had been forgiven through PSLF.
- That’s $980 per application.
- $85,995 was the average balance owed among those eligible for PSLF prior to the temporary eligibility expansion.
- $76,906 was the average discharge amount for an approved PSLF applicant.
- $9,089 was the average individual outstanding remainder.
- 96% of loans forgiven were on IDR plans.
- The remaining 4% used fixed repayment plans.
Public Service & PSLF
PSLF is one of the most well-known and most utilized student loan forgiveness programs. Employment with a government entity or non-profit organization may make you eligible for student loan forgiveness. Denied applicants may still be eligible for Temporary Expanded Public Service Loan Forgiveness (TEPSLF).
- An estimated 25% of the labor force in the US was in some way employed in public service when the PSLF program was created.
- That’s 42 million public service workers.
- 10 years is the minimum amount of time after graduation before you are eligible for PSL forgiveness, the equivalent of 120 qualifying monthly payments.
- Among the top 10 complaints about student loans, PSLF is the fourth most griped about.
- One-third of Americans strongly support PSLF.
- 57% of Americans support PSLF on some level.
- Black or African Americans are more likely to support PSLF than any other race.
- White or Caucasian Americans report the least support for PSLF.
- People with income exceeding $100,000 are more likely than those with lower incomes to oppose PSLF.
PSLF Temporary Expansion of Eligibility
Between Oct. 6, 2021, to Oct. 31, 2022, the U.S. Department of Education (ED) offered a temporary period during which borrowers could receive credit for payments that previously did not qualify for PSLF or TEPSLF. These were the expanded rules, that superseded conflicting normal requirements.
- Receive credit for periods of repayment made on Direct, FFEL, or Perkins Loans.
- Past payments under any plan count for non-consolidation loans through Sept 30, 2021.
- Past payments made on loans before consolidation count, even if on the wrong repayment plan.
- Past payments that were made late or for less than the amount due count for non-consolidation loans through Sept 30, 2021.
- Any past payments made on loans before consolidation count even if they were paid late or covered less than the amount due.
- Borrowers can receive forgiveness even if not employed or not employed by a qualifying employer at the time of application and forgiveness.
- All borrowers who submitted a limited PSLF waiver through the PSLF Help Tool on or before Oct. 31, 2022, will receive the benefits of the waiver if ED determines the employer is eligible.
PSLF Requirements and Eligibility
Prior to temporary eligibility expansion, the PSLF Program was so competitive that there were few exceptions to the rules. Requirements include submitting a PSLF Employment Certification Form (ECF) annually and when changing employers.
1. Employment by a United States governing organization
- Your job title is not relevant to qualify for PSLF, but your employer is. If you are employed by a government organization at any level (U.S. federal, state, local, or tribal).
- or a not-for-profit organization that is tax-exempt under Section 501(c)3 of the Internal Revenue Code.
- or AmeriCorps or Peace Corps as a volunteer, you may qualify for PSLF.
2. Full-time employment with the qualifying agency
- In this case, the meaning of “full-time” is defined by your employer at a minimum of 30 hours per week.
- Employment in multiple qualifying part-time jobs will make you eligible for full-time employment status provided you average a combined total of 30 hours per week.
3. Have direct loans or consolidate other federal student loans into a direct loan
- Direct loans, such as those received under the William D. Ford Federal Direct Loan Program, qualify for PSLF.
- Loans from other federal programs, such as the Federal Family Education Loan (FFEL) or Federal Perkins Loan Program, are not eligible unless they have been combined into a Direct Consolidation Loan.
4. Make 120 qualifying payments under a qualifying payment plan
- Repay your loans under an IDR plan.
- IDRs offered through the ED are all qualifying payment plans, including Pay As You Earn (PAYE) and Income-Contingent Repayment (ICR) Plans.
- Qualifying payments include those made after October 1, 2007, made for the full amount due and no later than 15 days after the due date.
- Only required payments made during qualifying employment may be credited toward a PSLF; any additional payments, such as those made during a deferment or forbearance.
- “Lump-sum” payments may count for up to 12 qualifying monthly payments.
- Submission of the ECF updates the number of qualifying payments made toward a PSLF.
- 6.7% of submitted ECFs are ineligible.
| Claims Approved | Claims Denied | Claims Pending | |
|---|---|---|---|
| Nov 2020 | 6,493 | 263,118 | 26,729 |
| Oct 2020 | 5,830 | 213,535 | 20,025 |
| Sep 2020 | 5,069 | 205,744 | 18,402 |
| Aug 2020 | 4,444 | 198,662 | 16,954 |
| Jul 2020 | 4,263 | 192,323 | 15,252 |
| Jun 2020 | 4,012 | 187,142 | 15,983 |
| May 2020 | 3,697 | 187,053 | 15,041 |
| Apr 2020 | 3,376 | 177,422 | 15,248 |
| Mar 2020 | 3,174 | 171,321 | 13,901 |
| Feb 2020 | 2,828 | 163,476 | 12,338 |
| Jan 2020 | 2,544 | 155,719 | 10,931 |
| Dec 2019 | 2,246 | 149,091 | 9,991 |
| Sep 2019 | 1,561 | 123,146 | 11,766 |
| Jun 2019 | 1,216 | 100,835 | 8,677 |
| Mar 2019 | 864 | 75,138 | 10,004 |
Temporary Expanded Public Service Loan Forgiveness (TEPSLF)
This is not the same as PSLF’s temporarily expanded eligibility; when a PSLF application is denied because some or all payments were not made on a qualifying repayment plan, loan forgiveness might still be available temporarily. To qualify for TEPSLF, you must have already submitted a PSLF application that has been denied.
- 2.84% of the 123,296 processed applications for TEPSLF have been approved.
- 68.6% of the 119,790 total rejected applications were from borrowers with fewer than 120 qualifying payments.
- 29.8% did not have loans eligible for TEPSLF consideration.
- 1.7% were due to the borrower’s failure to meet payment requirements during the previous 12 months.
- $287 million has been discharged to borrowers through TEPSLF.
- $44,017 is the average individual discharge amount.
- 37% of loans forgiven were on IDR plans.
- 8.1% were using fixed repayment plans, 4.6% on graduated repayment plans, and 0.3% of loans were under standard repayment plans.
| Claims Approved | Claims Denied* | Claims Pending | |
|---|---|---|---|
|
Jun 2023 |
3,506 |
119,790 |
928,042 |
|
May 2023 |
3,506 |
119,790 |
802,203 |
|
Apr 2023 |
3,506 |
119,790 |
624,939 |
|
Mar 2023 |
3,506 |
119,790 |
534,176 |
|
Feb 2023 |
3,506 |
119,790 |
236,281 |
|
Jan 2023 |
3,506 |
119,790 |
187,733 |
|
Dec 2022 |
3,506 |
119,787 |
85,686 |
|
Nov 2022 |
3,506 |
119,787 |
55,836 |
|
Oct 2022 |
3,504 |
119,786 |
28,634 |
|
Sep 2022 |
3,504 |
119,786 |
6,950 |
|
Aug 2022 |
3,504 |
118,595 |
1,956 |
|
Jul 2022 |
3,501 |
107,975 |
|
|
Jun 2022 |
3,450 |
92,558 |
|
|
May 2022 |
3,451 |
90,561 |
|
|
Apr 2022 |
3,452 |
86,892 |
|
|
Mar 2022 |
3,458 |
82,269 |
|
|
Feb 2022 |
3,466 |
75,923 |
|
|
Jan 2022 |
3,466 |
68,616 |
|
|
Dec 2021 |
3,460 |
41,820 |
|
|
Nov 2021 |
3,480 |
35,683 |
|
|
Oct 2021 |
3,362 |
31,806 |
|
|
Sep 2021 |
2,573 |
27,044 |
|
|
Aug 2021 |
1,795 |
18,131 |
|
|
Jul 2021 |
1,401 |
14,596 |
|
|
Jun 2021 |
948 |
11,170 |
|
|
May 2021 |
586 |
7,745 |
|
|
Apr 2021 |
224 |
6,405 |
|
| No data available on pending claims until August 2022 | |||
Borrower Defense to Repayment Discharge (BDPD)
If a school engages in misconduct in a way that directly relates to a loan or the educational services the loan paid for, students or alumni may be eligible for a Borrower Defense to Repayment Discharge.
- Out of 779,785 applications for BDPD, 190,869 have been accepted.
- Zero applications were approved between September 2021 and March 2022.
- In 2022, there were an average of 287,635 pending applications at any given time.
- With a 60.6% acceptance rate, this is the program most likely to result in loan forgiveness.
- 6.4% of applicants receive a partial discharge.
- The number of borrowers seeking BDPD doubled from August 2021 to January 2023.
- A total of $3.89 billion has been discharged since the program’s inception.
- 14.1% of applications come from the state of California.
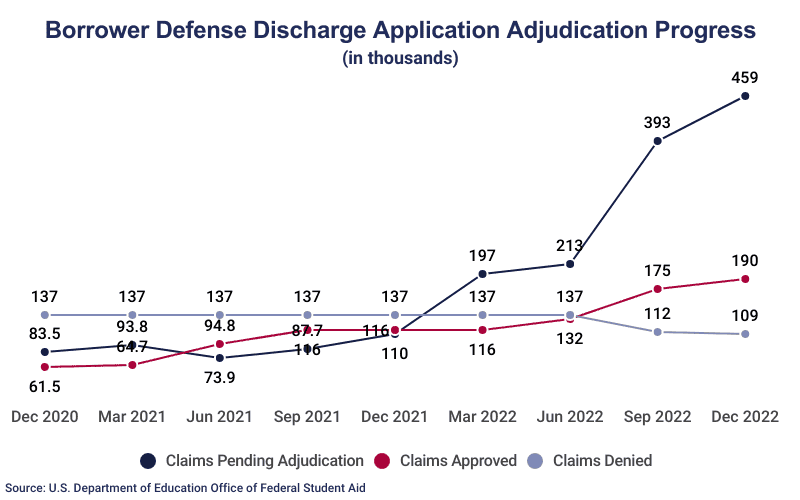
Official statistics on BDPD don’t “track.” At one point, at least 10,000 processed applications seem to disappear from the record; this error may be due to misfiled applications or mistakes in data entry.
BDPD Requirements and Eligibility
Despite a relatively high application acceptance rate, the BDPD program is still competitive. With an increase in the number of applicants and in the rate of rejected claims, understanding eligibility and requirements is essential.
- In some cases, those eligible for a BDPD may also be entitled to reimbursement for any loan payments made.
- Borrowers seeking loan forgiveness should use the borrower defense application provided by the ED (available on their official website).
- The ED recommends submitting supplemental material with applications to speed up verification processes.
- Transcripts, enrollment agreements, or registration documents include crucial details of your attendance at the institution in question.
- Emails with school officials may provide critical proof of the administration’s knowledge of or involvement in questionable practices.
- Promotional materials from the school provide evidence of their recruitment policies and practices.
- The school’s manual or course catalog detailing the school’s offerings as they may relate to the educational programming provided.
- In the event of electronic submission, these materials may be scanned and provided to the ED in portable document format (PDF).
| Claims Approved | Claims Denied | Claims Pending | |
|---|---|---|---|
|
Jan 2023 |
190,869 |
109,373 |
464,724 |
|
Dec 2022 |
190,476 |
109,393 |
458,725 |
|
Nov 2022 |
190,257 |
109,393 |
449,058 |
|
Oct 2022 |
189,653 |
109,393 |
400,055 |
|
Sep 2022 |
174,559 |
111,703 |
392,773 |
|
Aug 2022 |
165,193 |
114,757 |
342,032 |
|
Jul 2022 |
132,978 |
137,438 |
275,454 |
|
Jun 2022 |
131,811 |
137,438 |
212,876 |
|
May 2022 |
131,096 |
137,438 |
201,903 |
|
Apr 2022 |
130,820 |
137,438 |
194,634 |
|
Mar 2022 |
115,955 |
137,438 |
196,542 |
|
Feb 2022 |
115,955 |
137,438 |
168,730 |
|
Jan 2022 |
115,955 |
137,438 |
158,842 |
|
Dec 2021 |
115,955 |
137,438 |
109,953 |
|
Nov 2021 |
115,955 |
137,438 |
106,764 |
|
Oct 2021 |
115,955 |
137,438 |
102,273 |
|
Sep 2021 |
115,955 |
137,438 |
87,747 |
|
Aug 2021 |
98,582 |
137,413 |
78,651 |
|
Jul 2021 |
94,784 |
137,413 |
77,898 |
|
Jun 2021 |
94,784 |
137,413 |
73,910 |
|
May 2021 |
94,784 |
137,413 |
72,329 |
|
Apr 2021 |
94,784 |
137,413 |
107,825 |
|
Mar 2021 |
64,663 |
137,413 |
93,804 |
|
Feb 2021 |
61,511 |
137,401 |
86,624 |
|
Jan 2021 |
61,511 |
137,401 |
85,253 |
|
Dec 2020 |
61,511 |
137,391 |
83,463 |
Teacher Loan Forgiveness (TLF)
One of the oldest active student loan forgiveness programs, only educators who work in low-income† schools or educational entities may qualify.
- TLF has discharged a total of $3.87 billion in student loan debt.
- 469,867 teachers have successfully had their loans forgiven.
- There are 3.76 million full-time public school teachers working in the U.S.
- 2.40 million have taught for 10 years or longer.
- 1.99 million work in schools where more than 50% of students qualify for free or reduced lunch.
- The Teacher Loan Forgiveness Program has discharged over $3 billion in student loans.
- $266 million is the average annual total discharge.
- $8,497 is the average individual discharge.
†To qualify as a low-income school, at least 40% of students must be eligible for Title I aid.
Teacher Loan Forgiveness Requirements and Eligibility
Eligibility requires full-time employment at a low-income elementary school, secondary school, or educational service agency. Special education teachers may also be eligible. Additional rules‡ apply, with few exceptions.
- 5 years is the minimum amount of time you can be employed as a teacher before you qualify for teacher loan forgiveness.
- Full-time employment for 5 consecutive academic years is a prerequisite of teacher loan forgiveness.
- Exceptions may apply if your 5-year period was interrupted by active duty in the U.S. armed forces (reserves included).
- Exceptions also apply under the Family and Medical Leave Act of 1993.
- In order to apply for any exception, your employer must submit that you fulfilled your contract requirements for the academic years in question.
- In most cases, you have to have been employed full-time for at least half of the relevant academic year.
- At least one of these 5 consecutive years must be after the 1997-1998 school year.
- Loans can be forgiven only if they were initiated before the end of your 5 consecutive qualifying academic years.
- Up to $17,500 in student loans may apply for teacher loan forgiveness.
- This includes direct subsidized and unsubsidized loans and Federal Stafford loans.
- Defaulted loans are not eligible.
- To qualify as a teacher, you must fulfill several requirements.
- Qualified teachers have a Bachelor’s degree or higher.
- Teachers must have full certification for the state in which they are employed.
- Certification or license requirements must not have been waived for any reason.
- Teachers must either teach in a classroom or use classroom teaching methods in a non-classroom setting.
‡“You must not have had an outstanding balance on Direct Loans or Federal Family Education Loan (FFEL) Program loans as of Oct. 1, 1998, or on the date that you obtained a Direct Loan or FFEL Program loan after Oct. 1, 1998.” – ED Office of Federal Student Aid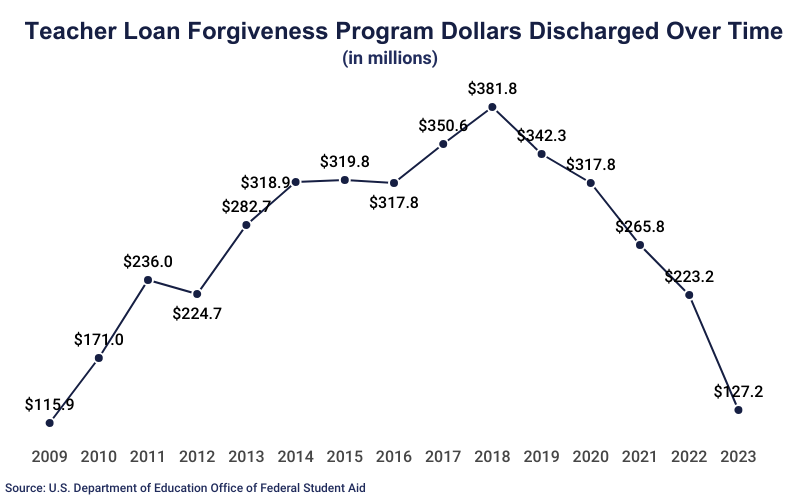
Closed School Discharge CSD
The closure of the institution to which you originally submitted your student loans may qualify you for a Closed School Discharge. You receive an automatic CSD after 1 year if your school closes on or after July 1, 2023, and you meet the eligibility requirements.
- Up to 100% of a loan balance may be subject to CSD.
- 148,300 borrowers have been approved for automatic CSD.
- $1.8 billion in automatic CSDs has been dispersed.
- $12,220 is the average approved individual discharge amount.
- If you qualify for a CSD, you may be reimbursed for any payments of the loan balance made voluntarily or through forced collection.
- All records of the loan, including repayment history and adverse history associated with the loan, may be expunged from your credit record.
- A rigid set of circumstances qualifies you for any CSD.
- You must have been enrolled in your school at the time of its closure.
- You may have been on an approved leave of absence at the time of closure.
- If you withdrew from the school within 120 days of its closure, you may still be eligible.
- You may not have completed all of your coursework, regardless of degree status.
- If you have already transferred your academic credits to another school, your loans may still qualify for a CSD.
Note: If you attended a school that is now closed, you may still be able to gain access to a copy of your academic records or transcript; contact the ED’s state licensing agency in the state where the closed school was located.
Total and Permanent Disability Discharge
A permanent disability that inhibits your employment may qualify you for a student loan discharge. Applications should be made to Nelnet, the servicer that processes such documents for the ED.
- To be considered, candidates must submit documentation from an acceptable official source, such as the U.S. Department of Veterans Affairs (VA), the Social Security Administration (SSA), or a licensed physician.
- The VA provides disability determination to veterans regardless of whether the disability is service-related.
- The SSA provides documentation to anyone eligible for Social Security Disability Insurance or Supplemental Security Income.
- A doctor of medicine (M.D.) or a doctor of osteopathic medicine (D.O.) physician’s certification must specify an inability to seek gainful employment due to any impairment that
- has lasted for a continuous period of at least 60 months, or
- is expected to last for a continuous period of at least 60 months, or
- is expected to be a fatal condition.
Discharge Due to Death
Death of the borrower (or in the case of a PLUS loan, the death of the borrower or of the undergraduate student) may result in a cancelation of federal loans. This is not an automatic discharge; even after the borrower’s death, their loans will continue to accrue interest with collections processed naming the borrower’s estate as the payee.
- 73% of student loan borrowers don’t know what will happen to their loan debt in the event of their death.
- 16% of borrowers who know what happens to their loans after death have life insurance averaging more than $330,000 to cover debts such as unpaid loans.
- A family member or representative of the deceased may provide their loan officer with documentation of the death.
- Acceptable documentation of the death includes an original death certificate or an official copy.
Other Loan Cancelation Programs
Your employment or volunteer service may make you eligible for a discharge(s). Other extenuating circumstances may also warrant a full or partial cancelation of your student loan debt. In the event that you are not eligible for loan cancelation, you may still be able to arrange some other means of debt relief using these programs and their requirements as a guide.
- Perkins Loans are need-based direct loans that may be canceled depending on your employment history or volunteer service.
- Although bankruptcy usually does not cancel student loans, there are certain circumstances under which one can apply for a federal loan Discharge in Bankruptcy.
- False Certification Discharges are applicable when a student is certified for student loans incorrectly and through no fault of their own.
- Disqualifying Status Discharge, Identity Theft, False Certification of Ability to Benefit, and Unauthorized Signature Discharge are types of loan forgiveness that may apply in the event of falsified certification.
- Unpaid Refund Discharge refers to the cancelation of student loans in the amount of an owed refund.
Private Student Loan Forgiveness Facts and Statistics
Forgiveness of private loans is rare. There is no current legislation regulating any kind of debt cancelation or forgiveness among private companies. Under certain circumstances, however, private loans may be forgiven on a case-by-case basis. There is no available data regarding how many loans or how much debt has been forgiven by private lenders over the years, and no entity collects such data.
- 7.52% of outstanding student loan debt comes from private loans.
- In the wake of COVID-19, some legislators promoted private student loan forgiveness as a method of debt relief.
- In July of 2020, the U.S. House of Representatives passed a bill to cancel up to $10,000 in private loans for each borrower, however, this proposal was rejected by the Supreme Court in June 2023.
- The Coronavirus Aid, Relief, and Economic Security (CARES) Act, while providing some relief in the form of deferred payments and collections, did not specify the cancelation of any loans.
Student Loan Debt Statistics
Student loans function under some unique rules. Debts vary across demographics, socioeconomic groups, and age groups, the last of which are heavily influenced both by rising educational costs and the time one group has had over another to repay debts. Trends in education costs, student loan debt, and debt repayments vs. defaults all contribute to the policies and processes of student loan forgiveness programs. It’s important to understand how student loans work when seeking out debt relief and/or student loan forgiveness.
- $1.62 trillion is the collective debt of 42.8 million American federal student loan borrowers.
- 30% of all adults incur some type of educational debt.
- 42% of young adults who go to college graduate in some type of debt, usually student loan debt.
- Nationally, outstanding student debt averages $22,500 (#6) per person.
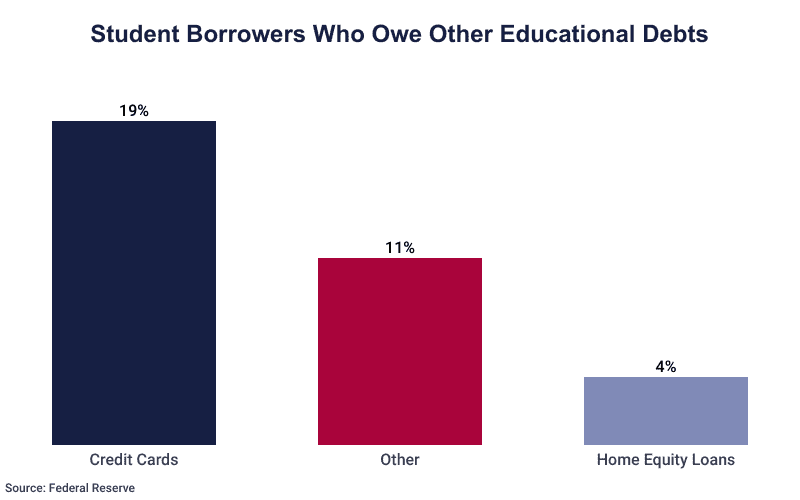
- 96% of those with outstanding education debt have student loan debt.
- $37,852 is the average individual student loan debt.
- The average loan payment is $515.
- $206.8 billion of collective student loan debt was overdue in March 2024.
- 27.28% of people who owed student loan debt were behind on payments.
- 1.64% of student loans were in delinquency or default (90+ days overdue).
- 8.4% of people with outstanding student loan debt had deferred loans prior to the onset of the COVID-19 pandemic.
- 23% of federal education lending goes towards Parent PLUS loans which provide outside financial assistance.
- In 2015, $404 was the average monthly amount householders under 40 spent on student loan repayments; this is more than the average family spent on groceries in a month.
- 96% of student loan borrowers in 2019 report putting off at least one major life/financial milestone due to their student debt; such milestones include home-buying, starting a family, and long-term savings.
- 68% of borrowers in 2019 say their student loan debts are the cause of their financial struggle.
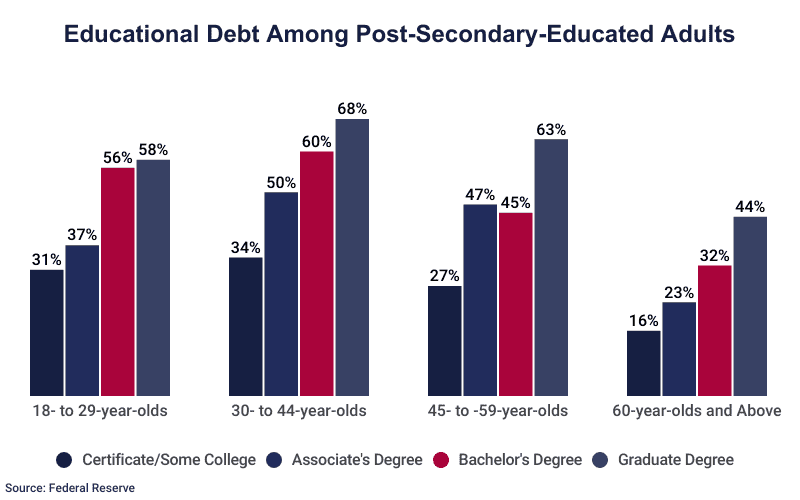
- College-educated adults between 30 to 44 years old owe more student loan debt than any other age group.
- College-educated adults over 60 owe the least amount of student loan debt.
- 58% of graduate degree holders under the age of 30 acquired student loans for education.
- 60% of bachelor’s degree holders aged 30 to 44 have acquired student loans for education compared to 45% of those aged 45-59.
Sources
- U.S. Department of Education (ED), Office of Federal Student Aid (OFSA), Data Center
- CNBC, Just 96 of 30,000 People Who Applied for Public Service Loan Forgiveness Actually Got It
- Cloudfront, YouGov RealTime, Student Debt Forgiveness Survey
- Enterval Analytics, Private Student Loan Report
- Forbes, House Passes Bill To Cancel $10,000 In Private Student Loans For Every Borrower
- Federal Reserve, Report on the Economic Well-Being of U.S. Households in 2022
- Business Insider, America’s Student Debt Nightmare Actually Started in the 1980s
- American Bar Association, Student Debt: The Holistic Impact on Today’s Young Lawyer
- Haven Life Insurance, Does Student Loan Debt Die When You Do?
- Office of Elementary & Secondary Education, Improving Basic Programs Operated by Local Educational Agencies (ESEA Title I, Part A)
- U.S. Bureau of Labor Statistics, Labor Force Statistics from the Current Population Survey: Labor Force Characteristics
- National Center for Education Statistics, Digest of Education Statistics
- National Association of Colleges and Employers,First Destinations for the College Class of 2022
- YouGov Survey: Student Loan Debt ( April 16 – 20, 2024)
- Supreme Court of the United States, Biden vs Nebraska